

Sweetpea is a restaurant chain located in San Francisco and New York City. They are a quick-style restaurant specializing in fresh salads and lunch bowls made with high quality locally-sourced ingredients.
Brief
1. Conduct a comprehensive carbon inventory for key business activities across Sweetpea's operation.
2. Develop a dashboard for key stakeholders to understand and visualize the data for FY 2019.
1. Conduct a comprehensive carbon inventory for key business activities across Sweetpea's operation.
2. Develop a dashboard for key stakeholders to understand and visualize the data for FY 2019.
FIGMA PROTOTYPE
Click on the blue tabs to explore the carbon inventory data and visualizations for each business activity at Sweetpea.
Sweetpea Carbon Inventory
Process
DEFINE
A carbon inventory is an analysis of the total greenhouse gas emissions emitted by a business. The food service industry is responsible for over a quarter of global greenhouse gas emissions, making it a key sector for mitigation. Business stakeholders utilize the data to report against mandatory third-party disclosures and release public-facing sustainability reports.
COLLECT
Sweetpea collects quantitative and qualitative data across five key business activities: (1) building operations, (2) waste, (3) production of food ingredients, (4) upstream logistics, and (5) packaging. The data is held in a .csv file.
CLEAN
Several data points were erroneous, duplicates, or outliers. There were also missing values and inconsistencies with data types, for example numerical values and numerical + character values. Data for irrelevant business activity categories were removed from the inventory altogether. Missing data values were flagged in the analysis. All cleaning methods were communicated to the client.
ANALYZE
The calculation for total emissions is the product of the activity data and the carbon emission factor. Additionally, the carbon inventory data was mapped alongside benchmark data, for a subset of the business activity categories, which was provided by the client.
VISUALIZE
The interactive dashboard was created in Figma and showcases the carbon inventory data and visualizations per business activity.
DATA & VISUALIZATIONS
Building operations
Waste
Production of Ingredients
Upsteam Logistics
Packaging
key business activities
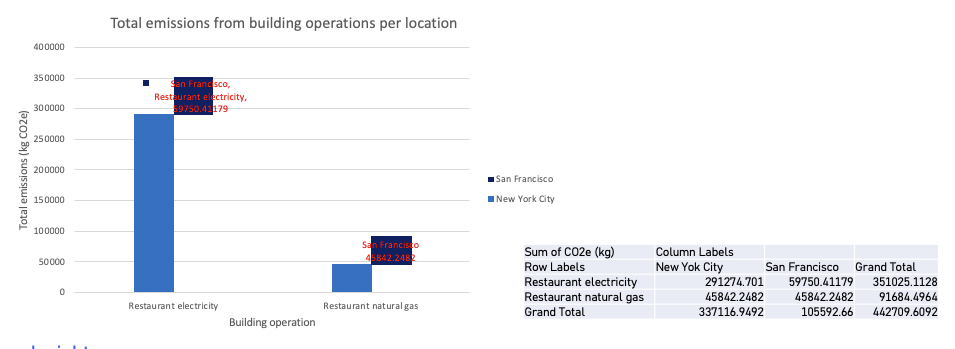
Building Operations
Electricity (kWh) and natural gas (mmBtu) data is extracted from utility bills. Carbon emissions factors come from the EPA, with different carbon intensities for different regional electricity grids.
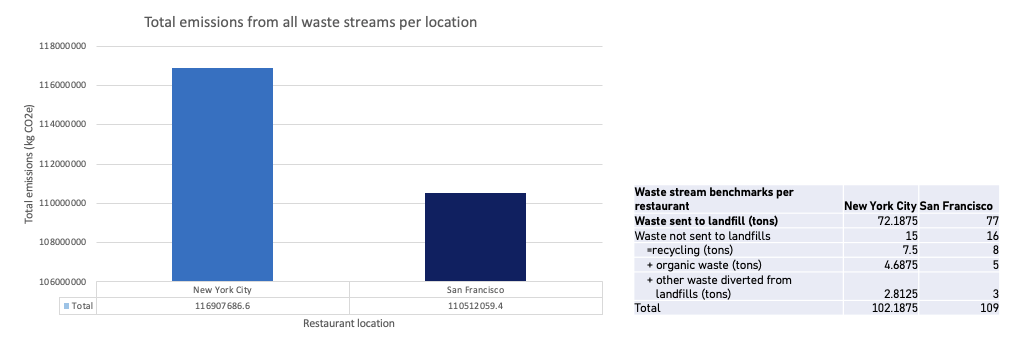
WASTE
Tons of waste (kg) by waste stream (recycling, compost, landfill), extracted from bills. Carbon emissions factors come from the UK government.
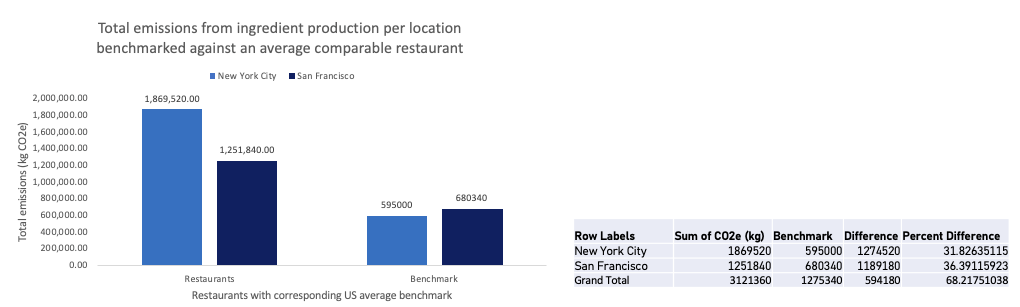
production of food ingredients
Total mass purchased for each ingredient (kg) and (L). Emissions factors come from a comprehensive analysis of food carbon intensity (emissions per [unit of food]).
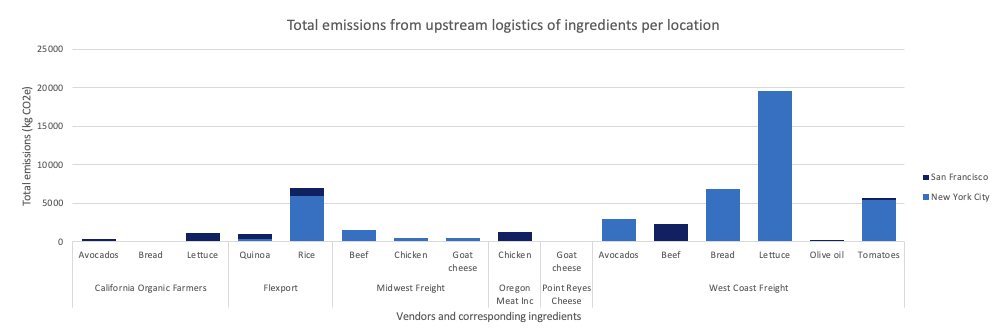
upstream logistics (transport of food from farm to table)
Weight of product (tonne-km) meaning one tonne of product that travels one km, calculated using distances between vendors and restaurants. Emissions factors assume a typical truck or container ship.
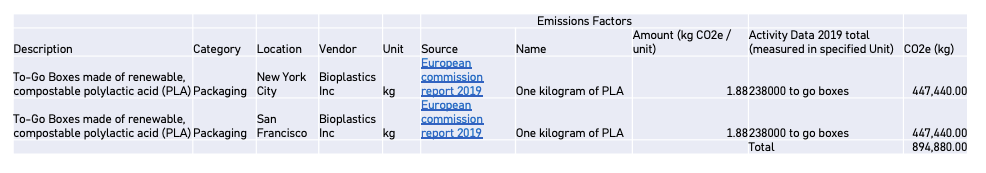
packaging
Sweetpea uses renewable polylactic acid (PLA) for their to-go containers, and emissions factors for bioplastic from a European Commission analysis have been applied.
Building Operations
Electricity (kWh) and natural gas (mmBtu) data is extracted from utility bills. Carbon emissions factors come from the EPA, with different carbon intensities for different regional electricity grids.
WASTE
Tons of waste (kg) by waste stream (recycling, compost, landfill), extracted from bills. Carbon emissions factors come from the UK government.
production of food ingredients
Total mass purchased for each ingredient (kg) and (L). Emissions factors come from a comprehensive analysis of food carbon intensity (emissions per [unit of food]).
upstream logistics (transport of food from farm to table)
Weight of product (tonne-km) meaning one tonne of product that travels one km, calculated using distances between vendors and restaurants. Emissions factors assume a typical truck or container ship.
packaging
Sweetpea uses renewable polylactic acid (PLA) for their to-go containers, and emissions factors for bioplastic from a European Commission analysis have been applied.